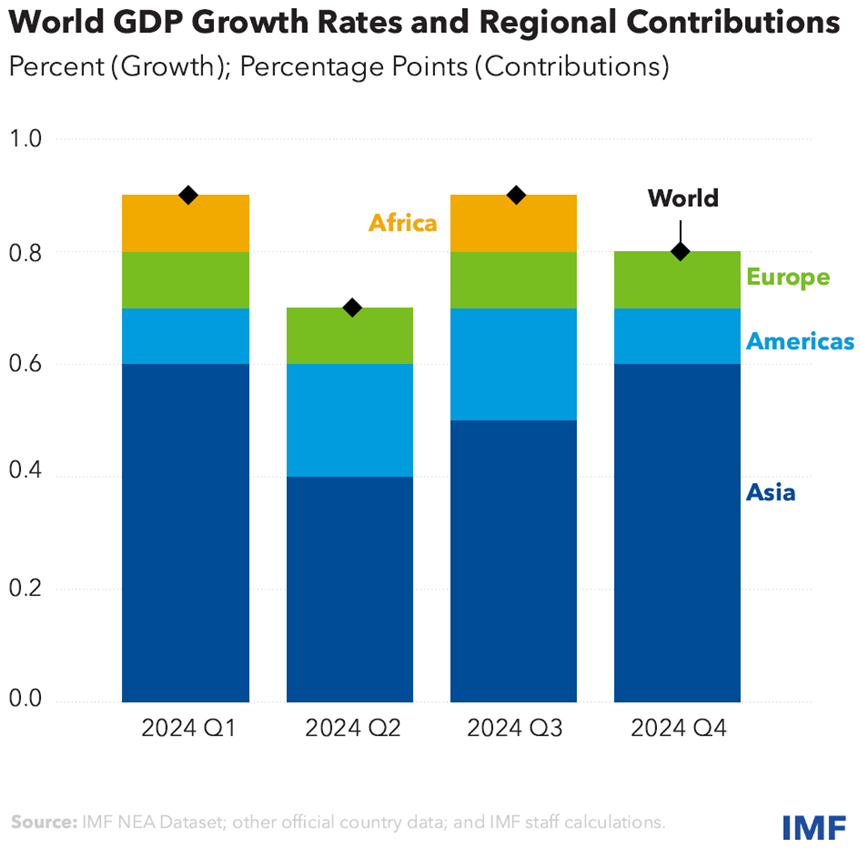
Quantifying economic risks through data visualization

See how data visualization helps analysts identify, measure, and present economic risks effectively. Gain insights into market shifts. Working in financial strategy for years has shown me a critical truth: understanding economic risks isn’t enough; we must measure and communicate them clearly. The sheer volume of market data, geopolitical events, and policy changes creates a…

Quantifying economic risks through data visualization

How to Understand Stock Market Fluctuations

The stock market can feel like a rollercoaster, with its ups and downs leaving investors wondering what’s next. Understanding why these fluctuations happen is key to making informed decisions and achieving your financial goals. Instead of being intimidated by the volatility, equip yourself with the knowledge to ride the waves and potentially profit from them….

How to Understand Stock Market Fluctuations